

Effectiveness Analytics
Effectiveness Analytics shows Audit Managers what share of completed corrective actions were actually checked for effectiveness — a core requirement of the CAPA process under ISO 9001 clause 10.2.1 e, whose evidentiary weight increases with the 2026 edition. Unlike Action Item Analytics, which shows effectiveness as just one of several metrics, this dashboard is built for it exclusively.
Who can use this
Section titled “Who can use this”- Audit Managers — full access to the dashboard
- Auditors and Auditees do not have access; like the other reporting views, this is intended for management-level reporting
The dashboard is read-only.
What the chart shows
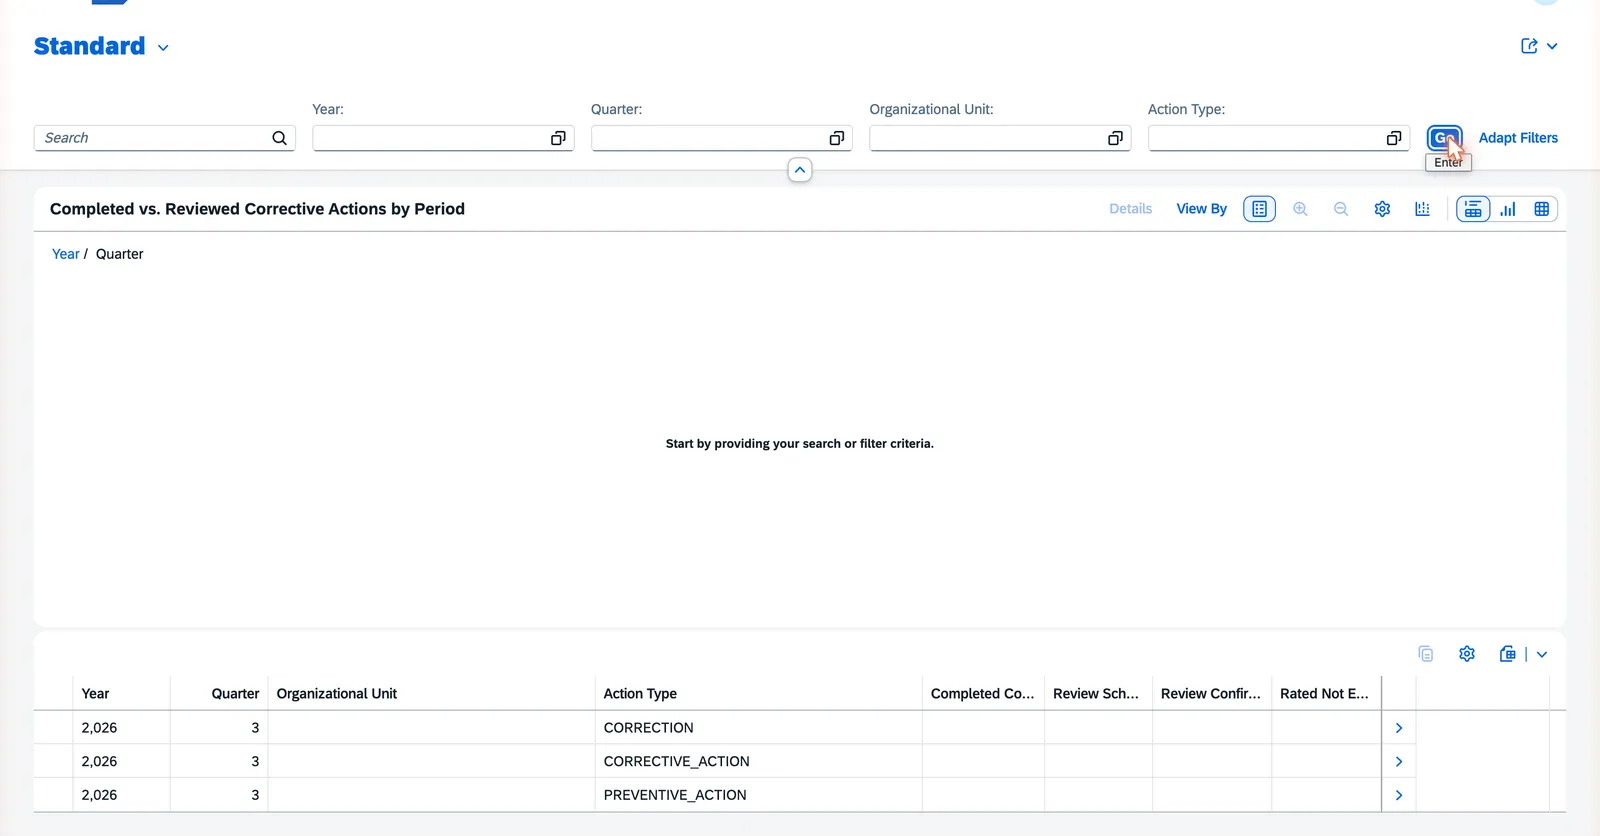
Section titled “What the chart shows”The chart compares how many corrective actions were completed in a period against how many of them actually went through an effectiveness review — by year and quarter.
Using the table
Section titled “Using the table”Below the chart, a table lists the same actions by year, quarter, organizational unit, and action type, with four measures per combination:
- Completed — the number of corrective actions completed in the period
- Review Scheduled — of those, how many have a scheduled effectiveness-review date
- Review Confirmed — of those, how many actually went through an effectiveness review
- Rated Not Effective — of those, how many the review found were not effective
That last column is deliberately not hidden away: a 100% effective rate is rarely a good sign — more often it’s a sign that effectiveness reviews aren’t being taken seriously. The ratio of “Review Confirmed” to “Completed” gives you the effectiveness quote for the selected scope.
Filtering the data
Section titled “Filtering the data”Use the filter bar above the chart — Year, Quarter, Organizational Unit, and Action Type — and choose Go to apply your filters.
Next Steps
Section titled “Next Steps”- Action Item Analytics — action item trends by open/overdue and status
- Action Items — how effectiveness reviews are recorded on individual action items